If you're an armchair geopolitics enthusiast, then you've likely been following the negotiations around the Strait of Hormuz these past couple months. There're lots of opinions on the conflict, but one thing's for certain:
Whether it's software, a PRD, or war, Claude is great at scaffolding a nice looking base and terrible at finishing the job.
Jokes aside, I'm concerned about the oil situation. Because depending on who you ask, we either have plenty of it or we're about to start riding bicycles to work.
To be fair, it's really easy to pick and choose inventory data that backs any viewpoint you like.
Want oversupply? US commercial crude is +5% off its January low. Propane stocks built to multi-year seasonal highs over the winter. etc.
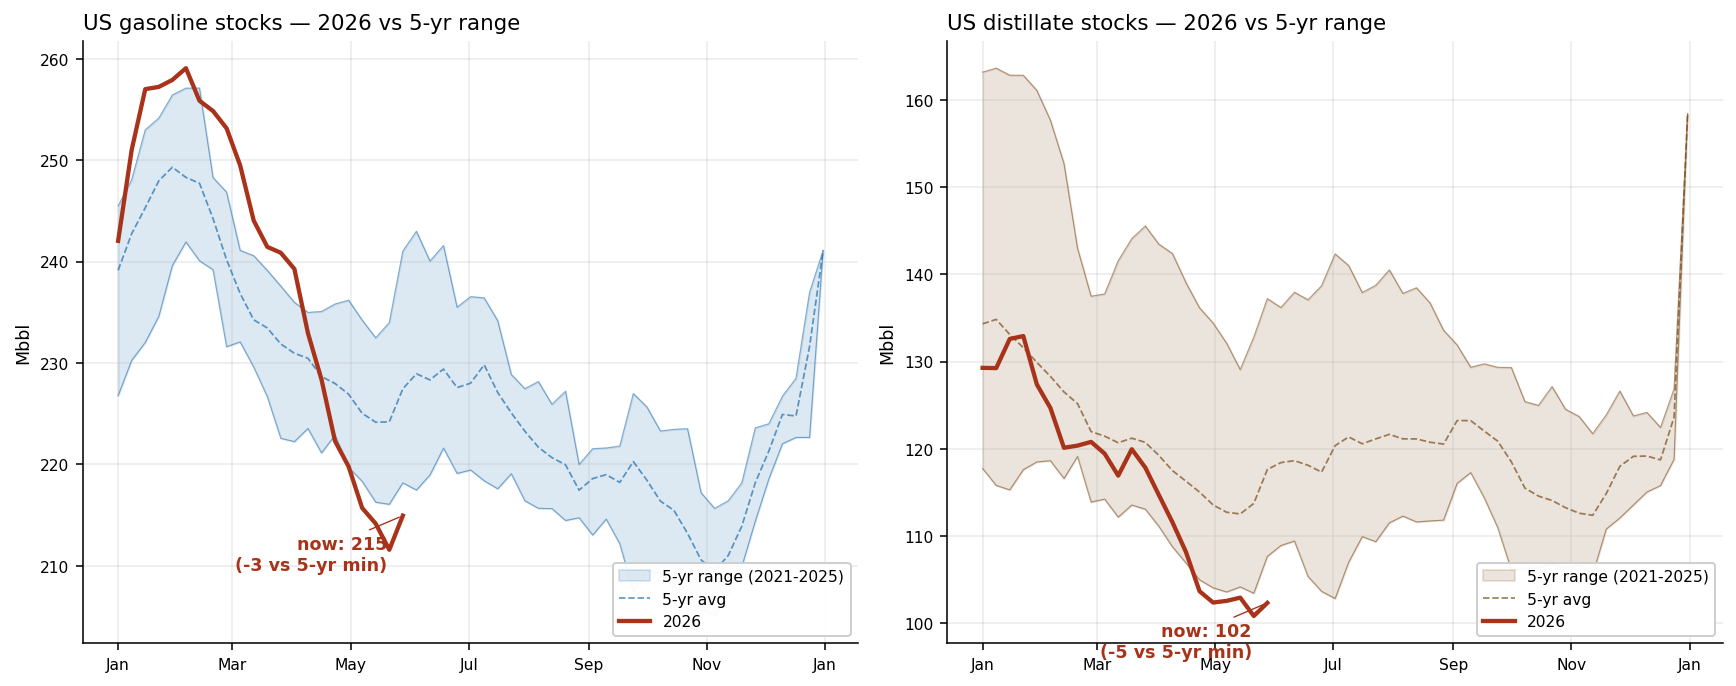
Want undersupply? US gasoline and distillate are both below their 5-year minimums for the week, entering driving season. etc.
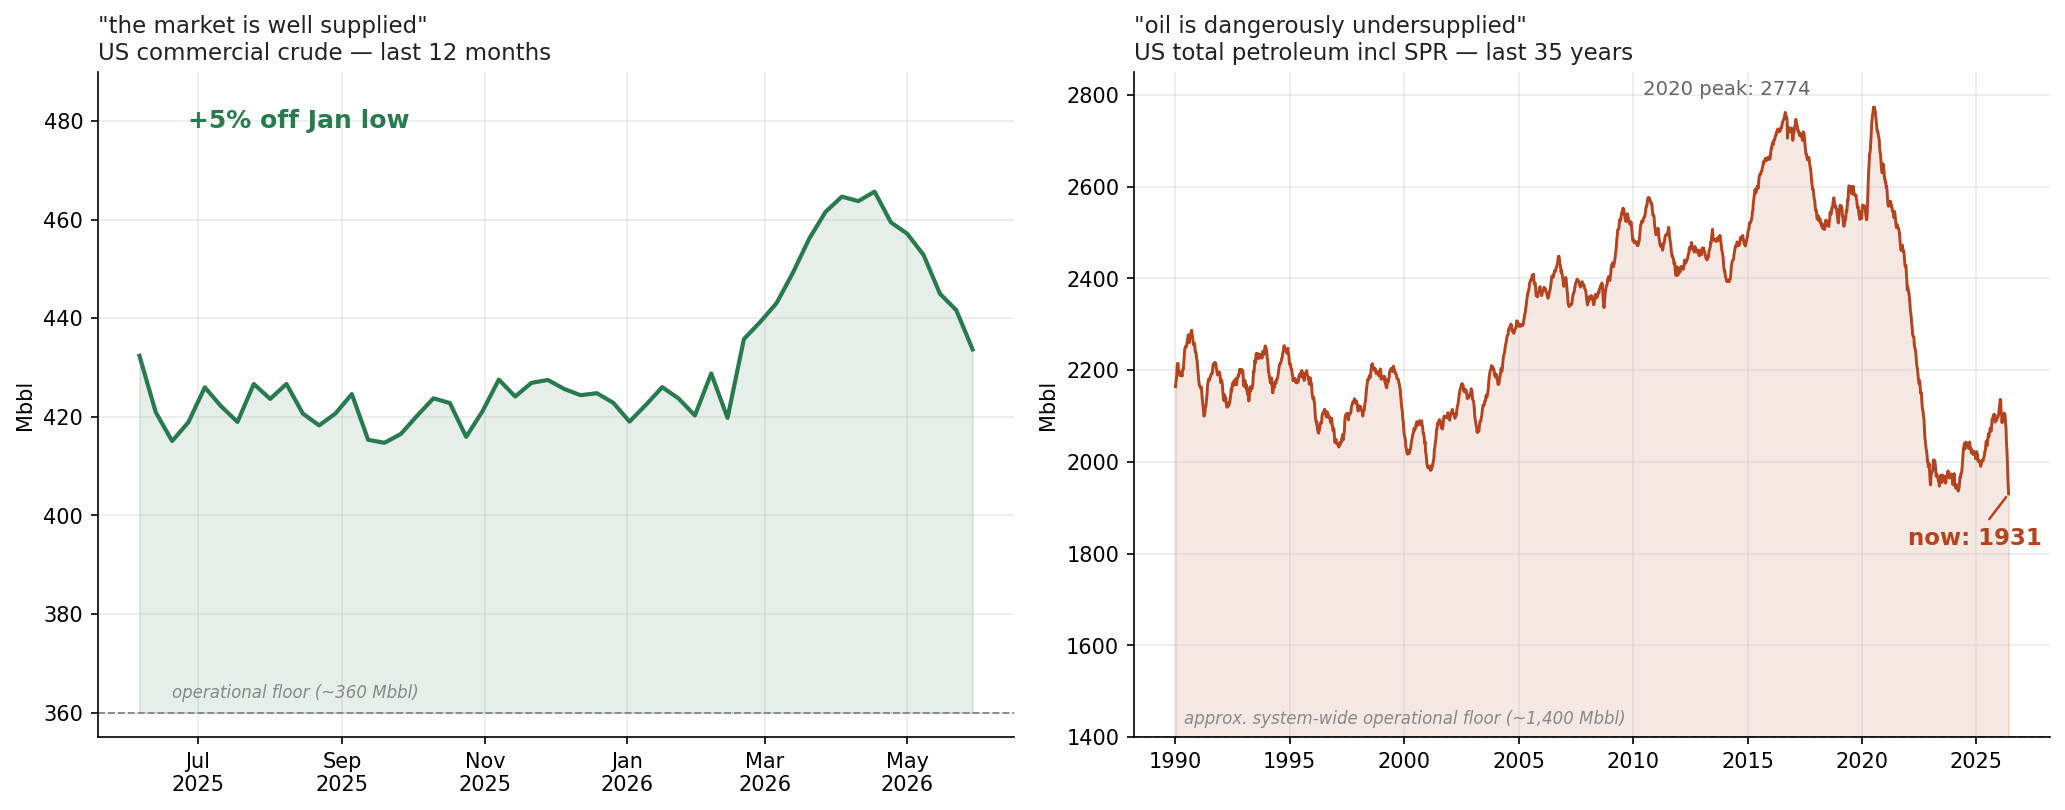
Both views are built from the same dataset and are internally coherent. So someone pointing to one or the other is telling the truth, even though it may be misleading.
How about non misleading charts?
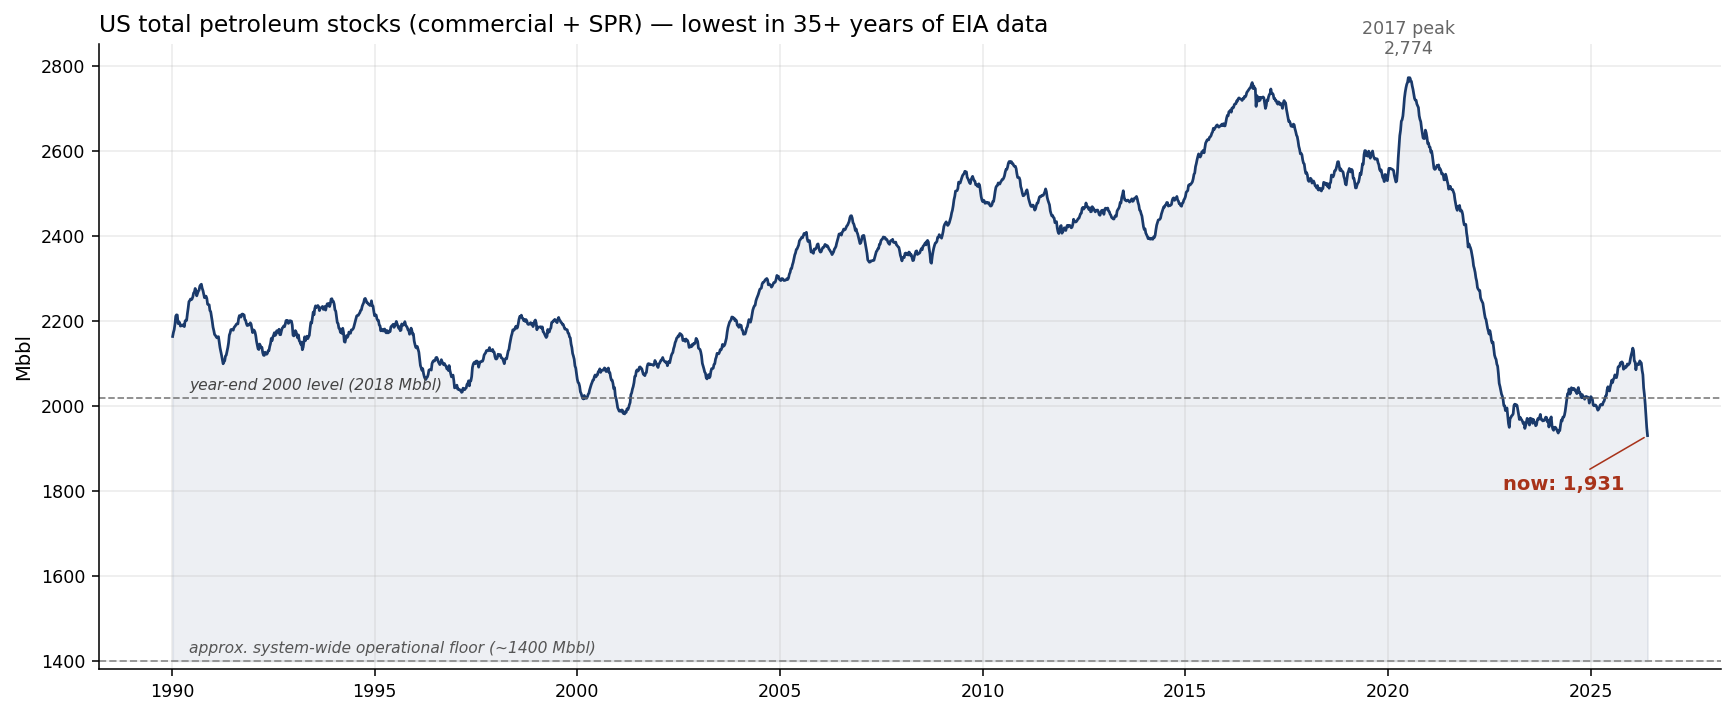
US total petroleum (commercial + SPR) is at the lowest level in 35+ years of EIA's modern weekly series. Lower than the year-end 2000 trough, lower than the 2020 COVID lockdown lows.
US gasoline (215 Mbbl) and distillate (102 Mbbl) are both below their 5-year minimum for the week, entering driving season.
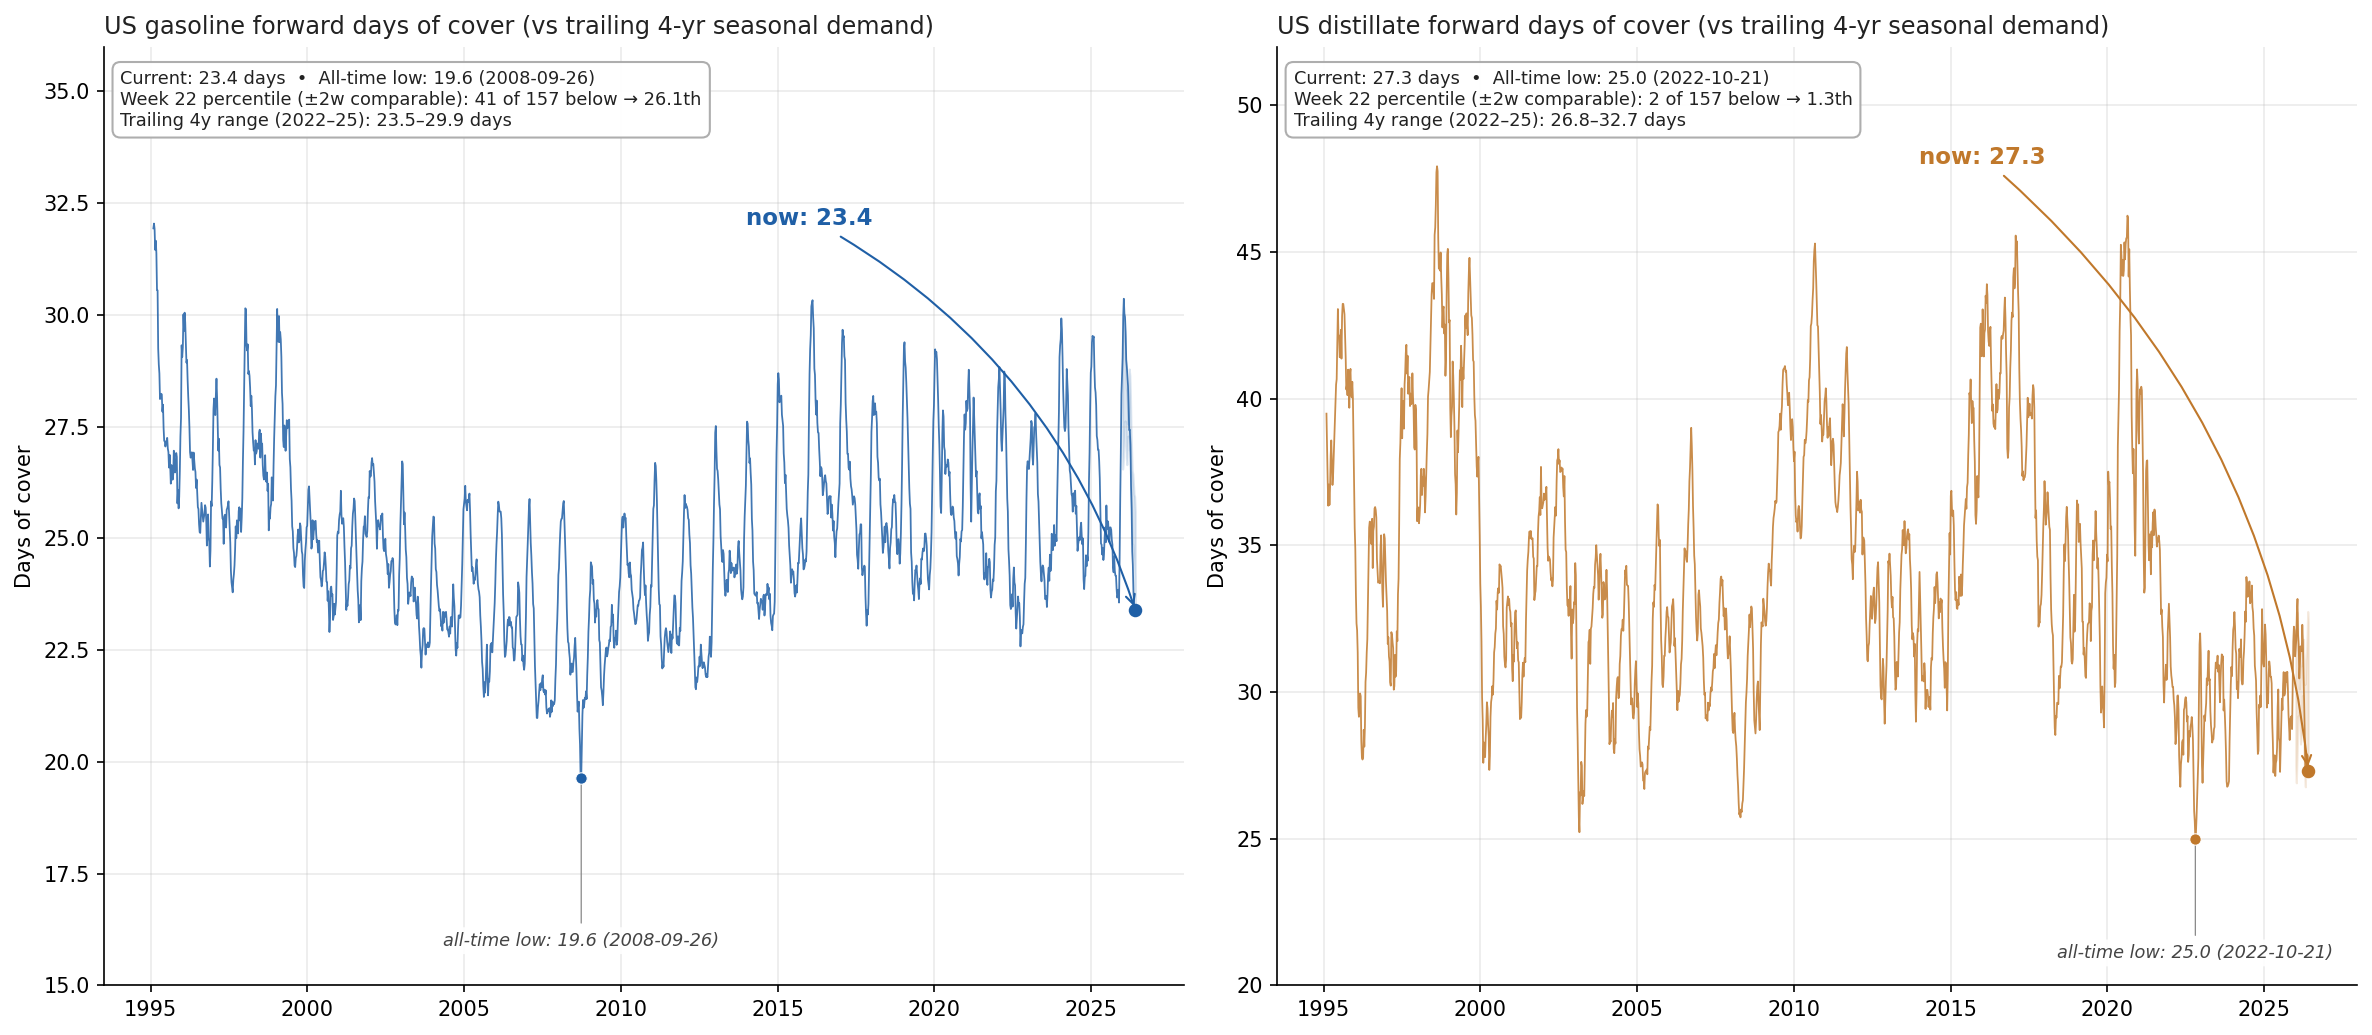
However, that doesn't account for difference in demand over time, so the better question is: how long do current stocks last at the typical forward consumption rate?
So I normalized it using following methodology: stocks divided by average daily demand over the next four weeks, using a trailing 4-year seasonal demand profile so each historical year is measured against the demand it actually faced, and ranked against comparable weeks of year (±2 weeks) across the full 35-year series.
The result is much more interesting: gasoline is only at the 23rd percentile of comparable historical weeks, tight for the season but not historically extreme.
Distillate is a way different story. It's at the 1st percentile of comparable weeks. Only 2 of 178 historical ±2-week observations had less supply at this time of year.
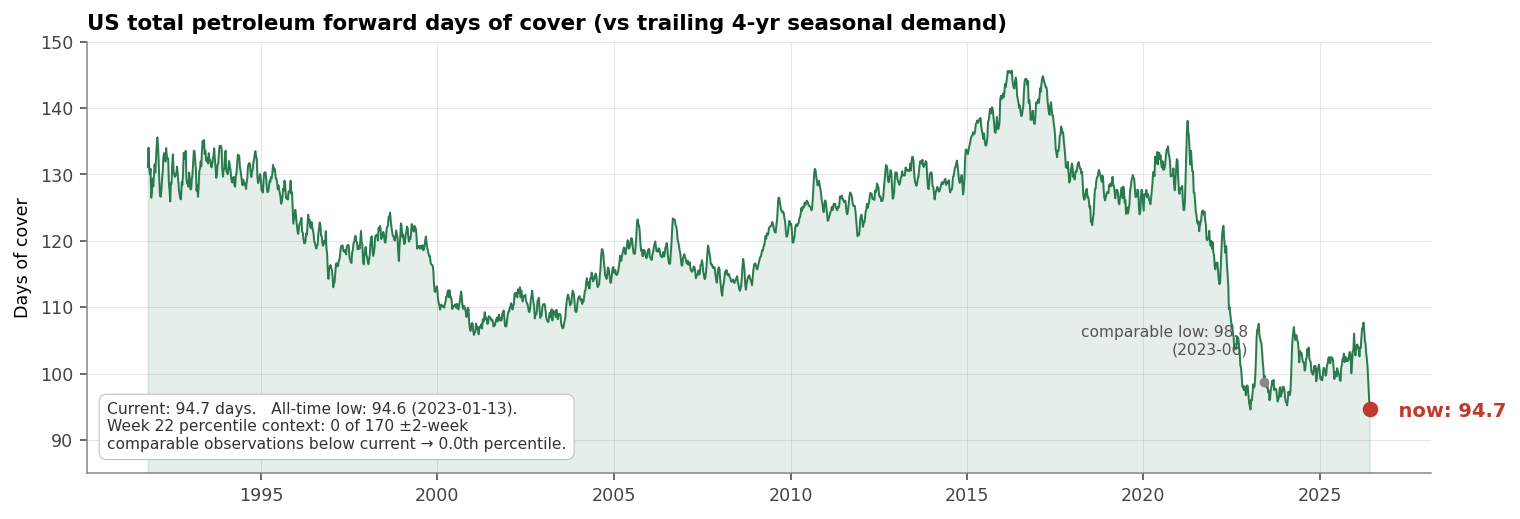
Running the same normalization on the headline chart doesn't soften it. Total petroleum (commercial + SPR) at 1,931 Mbbl divided by ~20 mb/d forward demand gives 94.7 days of cover — very close to a 35 year low.
Beyond the US weekly data, the picture gets vaguer. JODI is the only free, public, global stock dataset and it has structural problems:
- China isn't in it at all.
- Russia stopped reporting in 2021.
- Brazil in 2022.
- The latest fully reported month is March 2026 — as of writing (June), zero non-US countries have filed for April or May.
This is something that my stroke victim (Claude) had trouble reconciling for a while. 4 separate times actually, before I got to the bottom of it with some pointed questions. Never trust words on your screen, no matter how authoritative they sound.
Conclusion?
I'm not gonna source any of my statements below. Consider it a medium informed opinion:
The expert consensus on oil has been that the market had digested the war and priced in (likely excessive) upside relating to war escalation.
I'm not an expert on markets, oil, let alone commodities, but logically if consensus framing was right, oil would be inching higher the longer the conflict goes on, especially given the downright bipolar approach towards peace talks.
I'm also not convinced that we're close to a deal. The stated demands of both sides are pretty far apart, and you get the impression either one or both parties are waiting out the clock for one reason or another. I don't think it's worth thinking about the geopolitical dynamics of the situation beyond this point. It's televised chess but the real game of poker is under the table.
I know for an article like this to have a satisfying end it should include a prediction. So here are my 2c:
If we assume that we're unlikely to see flows from Hormuz reach US shores before the fall, distillate supplies are low and going up in price, and distillate price shocks impact whole economy since they're used in stuff like diesel which is used for stuff like shipping (and a whole lot more) we can then assume that there will be an inflationary impulse starting now-ish and going into the fall. However, because this inflationary impulse is because of decrease in energy supply, not increase in demand, it'll likely be stagflationary. So gold may be a good bet. Stocks less so (sans AI??) idk.