daily notes

previous notes →

Themes

Capability progress is outrunning task-cost improvement

Higher reasoning effort is lifting capability scores and task costs together. Artificial Analysis measures Fable 5.1 at 66 with a 20% higher task bill, and Gemini 3.8 Flash at 59 and $0.58 per task, about 40% above its predecessor despite unchanged token prices. Epoch’s separate frontier fit of 14 ECI points a year versus 6 measures capability progress, not equivalent cost savings.

updates 2026-09-01 · prior evidence ↗

Claude Fable 5.1 tops the Artificial Analysis Intelligence Index but costs 20% more per task than Fable 5 despite a 75% cache read price cut We supported @AnthropicAI with pre-release evaluation of Claude Fable 5.1. At max effort it scores 66 on the Artificial Analysis Intelligence Index, the highest score we have measured, ahead of Claude Opus 5 (max, 63), Claude Fable 5 (max, 62), GPT-5.6 Sol (max, 61) and Grok 4.6 (high, 61). We evaluated the model with Anthropic's ‘default’ server-side fallback, which routes safety-flagged requests to Claude Opus 4.8 or Claude Opus 5; fallback served ~4% of output tokens across the Intelligence Index. Key takeaways ➤ Frontier Intelligence with improvements across benchmarks: Fable 5.1 gains +4 points on the Intelligence Index over Fable 5. On HLE, Fable 5.1 scores 59.1%, ahead of the previous best of 55.5% from Claude Fable 5. It posts the narrowly highest scores we’ve seen on Terminal-Bench v2.1 (91.4%) and SciCode (62.0%), and on τ³-Banking it gains 9 points over Fable 5 ➤ 75% cache read price cut, but Fable 5.1 still costs more per task: Anthropic has cut the cache read price from $1 to $0.25 per 1M cached input tokens, with standard pricing unchanged at $10/$50 per 1M input/output tokens. Fable 5.1 (max) costs $3.76 per Intelligence Index task, 20% more than Fable 5 (max), because it uses ~1.7x the output tokens. The cache cut saves ~$1.40 per task, concentrated in the agentic evaluations where the majority of input tokens are cache reads. At xhigh effort Fable 5.1 scores 65 at $2.72 per task, $1.04 less than max, but still above Claude Opus 5 (max, 63) at $2.34 ➤ Claude Fable 5.1 holds the upper end of the Intelligence vs Output Tokens per Task Pareto frontier: every model variant scoring higher than GPT-5.6 Sol (medium) on the Intelligence Index is matched or beaten by a Fable 5.1 effort level on both intelligence and token usage ➤ Highest scores on agentic work tasks, but effectively tied with Opus 5: Fable 5.1 sets the highest scores we have measured on GDPval-AA v2 (1,853 Elo, +130 over Fable 5) and AA-Briefcase (1,694 Elo, +122 over Fable 5), our agentic knowledge work evaluations. Against Claude Opus 5 the GDPval-AA v2 lead is within the confidence interval and AA-Briefcase (1,685) is effectively tied, with Fable 5.1 ahead on analytical quality and rubric correctness, but behind on presentation Other model details: ➤ Context window: 1 million tokens, supporting image and text inputs as with Anthropic’s other recent launches ➤ Pricing: Fable 5.1 retains the $10/$50/$12.5 input, output, and cache write prices per million tokens from Fable 5, but cache hits have been reduced to $0.25 per million tokens, a 75% relative reduction from before that will materially reduce agentic workload costs

discussion1 selected reply
@ArtificialAnlysreply ↗

Claude Fable 5.1's five effort settings span 11x in output token usage, from 13.1M at low effort to 143.7M at max, and score from 58 to 66 on the Artificial Analysis Intelligence Index. Across effort levels Fable 5.1 sits on the Intelligence vs Output Tokens frontier, but its floor is higher than the GPT-5.6 family's: GPT-5.6 Sol (medium) uses marginally fewer tokens than Fable 5.1 (low), 12M against 13.1M.

Google has released Gemini 3.8 Flash, its fourth Flash model in under four months - it scores 59 on the Artificial Analysis Intelligence Index and reaches the Intelligence vs. Cost per Task Pareto frontier @GoogleDeepMind released Gemini 3.8 Flash today. With high reasoning, it scores 59 on the Artificial Analysis Intelligence Index, up 3 points from Gemini 3.7 Flash and on par with sub-maximum reasoning efforts of GPT-5.6 Sol (xhigh, 59) and Grok 4.6 (medium, 59) Matching Gemini 3.7 Flash’s discounted pricing until the end of the year ($0.75/$3.75 per million input/output tokens), Gemini 3.8 Flash sits on the Intelligence vs. Cost per Task Pareto frontier at $0.58 per task. This is comparable to GPT-5.6 Terra (max, $0.53), but ~40% higher than its predecessor, driven by a 30% increase in average output tokens per task to 48k and increased turns on agentic evaluations Key benchmarking results across Gemini 3.8 Flash’s three reasoning levels: ➤ 3 point Intelligence Index improvement: Gemini 3.8 Flash (high) scores 59 on the Artificial Analysis Intelligence Index, up 3 points from Gemini 3.7 Flash (high, 56). With medium reasoning it scores 57, matching GPT-5.6 Terra (max, 57) and Muse Spark 1.2 (xhigh, 57). With low reasoning it scores 52, matching Gemini 3.6 Flash (high, 52), at 30% lower Cost per Task and roughly a third of the Time per Task ➤ Agentic capability improvements: Gemini 3.8 Flash’s 3 point improvement on the Artificial Analysis Intelligence Index is primarily driven by stronger performance on agentic evaluations such as 𝜏³-Banking (tool use), Terminal-Bench v2.1 (coding) and GDPval-AA v2 (real-world tasks). The largest improvement is on 𝜏³-Banking, where it gains 12 points over Gemini 3.7 Flash to score 45% ➤ Pareto frontier on Intelligence vs. Cost per Task: Gemini 3.8 Flash (high) costs $0.58 per Intelligence Index task, making it the cheapest model at its level of intelligence. This is up ~40% from Gemini 3.7 Flash ($0.40) despite unchanged per-token pricing, driven by a 30% increase in output tokens per task and more turns on agentic evaluations. Cost per Task falls to $0.41 with medium reasoning and $0.24 with low reasoning ➤ Output speeds remain fast, but Time per Task increases: On high reasoning, Gemini 3.8 Flash averages ~300 output tokens per second and a Time per Task of 2.5 minutes, slightly faster than GPT-5.6 Luna (max, 2.6 minutes) and GPT-5.6 Terra (max, 3.3). Compared to Gemini 3.7 Flash, higher token usage increases Time per Task from 2.2 minutes to 2.5 minutes, and puts it behind Claude Fable 5.1 (medium, 2.1 minutes). On low reasoning, Time per Task falls to 0.8 minutes, placing Gemini 3.8 Flash on the Intelligence vs. Time per Task Pareto frontier Key model details: ➤ Context Window: 1M tokens, unchanged from Gemini 3.7 Flash ➤ Multimodality: Text, image, video, and speech input, with text output ➤ Pricing: $0.75/$3.75 per 1M input/output tokens through the end of the year, matching Gemini 3.7 Flash’s current discounted pricing. $1.50/$7.50 per 1M input/output tokens at standard pricing. Cached input tokens retain the same 90% discount
Must read

Cline’s September 2 postmortem explains a dual-bundle loader, activation fallback, shared state and a gradual rollout inside a marketplace without native release cohorts. Its comparable production telemetry put tasks hitting three consecutive mistakes at 6.34% on the old harness and 0.62% on the new one. Read the implementation and measurement sections: this is a specific failure threshold, not a tenfold improvement in every kind of agent reliability.

Epoch fits the state-of-the-art reasoning-model frontier after September 2024 at 14 ECI points a year, versus 6 for non-reasoning models. The article shows the linear fits and 90% prediction intervals rather than presenting the slope as a causal effect. It is worth the full read because the methodology, sensitivity to frontier construction and uncertainty around the short post-o1 window determine how much weight the apparent acceleration deserves.

source post shown above ↑

Artificial Analysis puts Fable 5.1 at 66 on its Intelligence Index, four points above Fable 5, while max-effort task cost rises 20% to $3.76 despite a 75% cache-read price cut. The thread is useful because it decomposes the bill into output-token use, cache savings and effort settings, then shows overlapping confidence intervals on professional-work benchmarks. Read it as an independent harness-specific measurement, not a universal ranking of intelligence.

updates 2026-09-01 · prior evidence ↗

Signals

Meta has released Muse Spark 1.3, their fourth Muse Spark model release in five months. Muse Spark 1.3 (max), which is in limited preview for Meta’s partners, scores 62 on the Artificial Analysis Intelligence Index, behind only Claude Fable 5.1 and Claude Opus 5. The variant available now, Muse Spark 1.3 (xhigh), scores 61 and ties with GPT-5.6 Sol (max) and Grok 4.6 (high). Both variants’ gains come primarily from improvements in agentic work and scientific capabilities Muse Spark 1.3 (xhigh) enters the Artificial Analysis Intelligence Index at 61, up 4 points from Muse Spark 1.2 (57, August) and 8 points from Muse Spark 1.1 (53, July). It enters tied with GPT-5.6 Sol (max), Grok 4.6 (high), and Claude Opus 5 (high), and behind Claude Fable 5.1 (max, 66), Claude Opus 5 (max, 63), and Claude Fable 5 (max, 62) Muse Spark 1.3 (max), which is in a limited preview stage, lands at 62. This higher index score is enabled by gains vs. Muse Spark 1.3 (xhigh) in Tau3-Bench Banking (52% vs. 47%) and GDPval-AA v2 (1,754 Elo vs. 1,709). Muse Spark 1.3 (max) is second only to Claude’s Fable and Opus variants in total score Congratulations to @AIatMeta, @finkd, and @alexandr_wang on the release! Key Takeaways: ➤ Continued improvement on agentic knowledge work tasks. At the launch of Muse Spark 1.2, we noted its significant gains in agentic knowledge work performance vs. Muse Spark 1.1. The latest iteration continues this trend, with Muse Spark 1.3 (xhigh) demonstrating a notable 12-point gain vs. Muse Spark 1.2 in Tau3-Bench Banking (35% to 47%), a 5-point gain in Terminal-Bench 2.1 (80% to 85%), and a new GDPval-AA v2 Elo of 1709 against its predecessor’s 1615. Muse Spark 1.3 (max) improves further on Tau3-Bench Banking (52%) and GDPval-AA v2 (1,754 Elo). This Tau3-Bench Banking score is #1 among all models. Muse Spark 1.3 (max) achieves these higher agentic work scores by using more turns and total reasoning tokens, reasoning 62% more on GDPval-AA v2 and 28% more on Tau3-Bench Banking compared to Muse Spark 1.3 (xhigh) ➤ The lowest cost per task for any model at 59+ on the Artificial Analysis Intelligence Index. Muse Spark 1.3 (xhigh) costs $0.55 per Intelligence Index task at Meta's unchanged $1.25/$4.25 per 1M token pricing ($0.15 for cached input), with its peers GPT-5.6 Sol (max) and Grok 4.6 (high) costing $0.95 and $0.94 respectively, a 70%+ premium. This places Muse Spark 1.3 (xhigh) on the Pareto frontier for Intelligence vs. Cost per Task. Its cost per task is higher than Muse Spark 1.2 ($0.40 per task), driven by ~57% more input tokens per task on agentic evaluations, with output tokens up only ~8%. Pricing for Muse Spark 1.3 (max) is not yet publicly available ➤ Scientific Reasoning results rose across the board, led by CritPt. CritPt was the standout non-agentic score gain vs. Muse Spark 1.2, with a material +8 points for the xhigh variant (18% to 26%), and GPQA Diamond achieved +4 points (90% to 94%), while Humanity’s Last Exam and SciCode each gained a more modest 2-3 points (45% to 47% and 56% to 59%, respectively). Muse Spark 1.3 (max) achieved roughly similar scores to the xhigh variant, gaining 2 points in Humanity’s Last Exam, tying on GPQA Diamond, and losing a point on CritPt vs. Muse Spark 1.3 (xhigh) ➤ Minor regressions in only two evaluations. Both Muse Spark 1.3 (xhigh) and Muse Spark 1.3 (max) dropped 4 points in AA-LCR (83% to 79%) when compared to Muse Spark 1.2, and AA-Omniscience (Accuracy) fell 3 points for xhigh and 1 point for max. The drops in AA-Omniscience (Accuracy) are due to a higher abstention rate (not answering questions when unsure), which also lowered the hallucination rate for Muse Spark 1.3 (xhigh) Other model details (xhigh variant): ➤ Context window: 1M tokens, unchanged from Muse Spark 1.2 ➤ Pricing: unchanged from Muse Spark 1.2: $1.25/$4.25 per 1M input/output tokens, with cache hits discounted to $0.15 per 1M ➤ Input modalities: text, image, video ➤ Availability: Meta's first-party API and Muse Code

Artificial Analysis’s later September 2 evaluation puts the available Muse Spark 1.3 xhigh at 61 and $0.55 per task, versus Gemini 3.8 Flash high at 59 and $0.58. That supersedes the earlier Flash report’s cheapest-at-this-level claim within this harness. Muse’s max variant scores 62 but remains a limited preview with unpublished pricing; the available xhigh variant also regresses on long-context reasoning.

Anybody can build an Asimov 1 now. The latest design update strips steps out of the assembly, opens up the parts you need to reach, and puts metal where plastic used to break. New CAD files are on GitHub. https://t.co/fX6pwoqFod

discussion3 selected replies
@asimovincreply ↗

Every screw is in the CAD. Hover over one and it tells you M4x8. You know the position, the count and the type before you pick up a tool. https://t.co/CsUdW2h7UQ

@asimovincreply ↗

The arms use heat-set inserts. You never place a nut blind again. Miss one before the motor went in and you used to take the whole arm apart. https://t.co/Q9iO3MSDKB

@asimovincreply ↗

Two panels are gone. The small back panel, and the covers over the ankle mechanism. Fewer parts to remove, fewer parts to lose. https://t.co/GMkqACTSTT

Asimov published a new CAD design aimed at simpler assembly, easier access and more durable components. The release makes the robot more inspectable and buildable, but its public thread supplies no independent measurements of assembly time or failure rates.

Sentiment

More capability, selective cost gains +0.36

56 source items · 70% editorial confidence

Themes

Modest growth still produces little hiring

The latest releases describe a growing economy with subdued hiring. The Fed’s September 2 Beige Book, based on contacts through August 24, reports growth in ten districts and very slight employment gains; ADP estimates 38,000 additional private jobs in August, its slowest pace since January. In a separate July measure, BLS found significant payroll gains in 19 of 387 metro areas year over year, using data that are not seasonally adjusted.

Memory and interconnect are rewriting AI rack economics

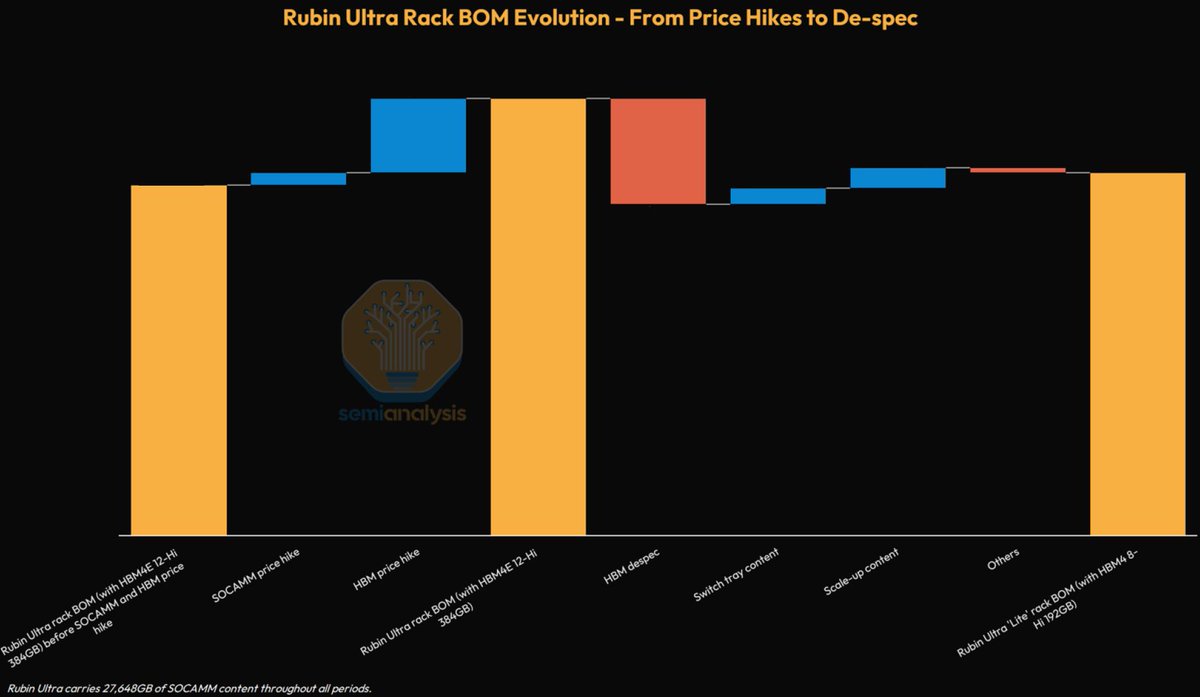
Memory and interconnect are absorbing enough of the AI budget to change product design. SemiAnalysis says Nvidia halved Rubin Ultra's HBM from 384GB to 192GB after memory reached roughly 40% of total capital cost, while Credo reported 115% revenue growth and guided $525M-$535M next quarter. The constraint has moved beyond accelerators into the rest of the rack.

Nvidia has despecced Rubin Ultra's HBM: from HBM4E 12-Hi (384GB) down to HBM4 8-Hi (192GB). Why strip memory out of your flagship rack-scale system? Because after the latest HBM and DRAM price hikes, memory had quietly become ~40% of total capital cost of ownership. We ran the TCO math in a recent conference keynote (1/3)🧵

SemiAnalysis chart comparing Rubin Ultra memory and interconnect shares before and after the HBM specification change.
source image · full size ↗
discussion1 selected reply
@SemiAnalysis_reply ↗

The despec cuts HBM cost by >50% — even with the 2026 HBM price hike already baked in — and takes memory from ~40% to ~28% of total capital cost. But that spend doesn't vanish. It's redirected into scale-up networking: on the NVL576 NPO SKU, scale-up triples from 4% to 12% of rack spend as optics take over rack-to-rack interconnect. (2/3)

Must read

big fan and learn a lot from both of these guys but some of these numbers are hard to grasp here if I'm understanding correctly. tbf don't think they're presenting this as a base case, but also don't explicitly label it as the ultra bull case either. tried to do the "what I have to believe" for the rate of change and its eye watering. they're the AI experts, so can weigh appropriately but just humbly doing some math on the comments. Compute >Today: $10B-$15B/GW-year of contracted compute rent. Assuming 500K accelerators/GW and 85% utilization, that is $2.70–$4/GPU-hour. >Takeoff: $25B-$50B/GW-year, or $6.70-$13.40/GPU-hour. Dylan says this is what labs may need to pay to capture 70%-80% of new compute. >The jump: compute pricing rises 2x–4x while we're adding 10s of GW per year (more below). At $50B of peak inference revenue today, the spread over compute is $35B-$40B/GW. At $70B-$80B of future blended revenue density, the spread is $20B-$55B against scarcity pricing applied more broadly across entire fleets. Revenue >Today: Anthropic inference revenue has reached $50B/GW annualized on its highest-monetizing capacity. That is a peak on the inference slice, not its fleet-wide average. >Takeoff: Dylan sees $70B-$80B/GW blended by YE27 and $100B+/GW in the unconstrained case. Those equal $18.80–$21.50 and $26.90+ per utilized GPU-hour. >The jump: At 100 GW, applying $50B-$80B only to a 40% inference share produces $2T-$3.2T of revenue. Applying the $70B–$80B blended figure across the whole fleet produces $7T–$8T. At $3T, that is 1.7x Mag4 TTM revenue, 47% of global IT spending and 9% of US GDP. Physical build >Takeoff: Global AI IT additions: 30 GW in 2026 → 50 GW in 2027 → 70 GW in 2028 → 90-100 GW in 2029. >Implied US takeoff: Dylan has separately put US 2026 additions at ~20 GW of IT load = US near two-thirds of this year deployment held steady gives 20 → 33 → 47 → 60–67 GW. At 1.2 PUE, annual facility-power additions are +24 (2026) → +40 (2027)→ +56 (2028) → +72–80 GW (2029). >The jump: That requires FTM + BTM delivery to more than double by 2028 and triple by 2029. SemiAnalysis is more bullish this year than the mid-teens numbers I've been able to reconcile in 2026 and you still need to 3x from that year over 3 years. Capital >Today: combined cloud RPO/backlog is ~$2.3T. Top-five hyperscaler capex is expected to rise from $800B-$860B in 2026 to $1.1T-$1.3T in 2027. >Takeoff: 70%-80% of 70 GW means 49-56 GW of lab additions in 2028. At $40B-$60B/GW, that is $2T+ of capex (and equipment is moving up - i.e. memory + accelerators). At $25B-$50B/GW to rent compute, it is $1.2T-$2.8T of annual compute rent expense. >The jump: $2T-$2.8T is 1.5x-2.5x the entire top-five hyperscaler capex expected for 2027. Current economics vs. takeoff endpoint probably belong in separate cases but the rate of change btwn is insane regardless. I’m sure I’m missing something, but this is how I read the rate of change math.

Mathew translates a bullish AI-infrastructure takeoff case into compute prices, revenue per gigawatt, physical power additions and capital requirements. The arithmetic makes the burden explicit: a 100 GW fleet at the cited revenue densities reaches trillions of dollars, while a 2028 lab build could require more annual compute rent and capex than current hyperscaler plans. The post is valuable as a ‘what must be true’ bridge, not a forecast; several inputs come from the scenario it is challenging.

Adrian argues that shock-prone monetary policy needs conditional scenarios and a legible reaction function rather than precise rate-path commitments. Forecasts should carry risks and escape clauses, while normal market moves around incoming data can improve price discovery instead of representing a communications failure. The full article is a compact framework for judging central-bank guidance when fiscal, energy and geopolitical conditions move faster than a fixed path.

O'Trakoun separates the headline unemployment rate from the declining probability that long-term unemployed workers find jobs. The article distinguishes 27-52 week spells from unemployment lasting at least 53 weeks and uses the outflow rate to show why a stable aggregate rate can hide worsening reemployment prospects. It is worth reading because duration composition can change the labor-market signal before the headline rate does.

Signals

Broadcom reported $16.7B of AI semiconductor revenue in fiscal Q3 ended August 2, up 221% year over year and 54% sequentially. The September 2 release guides fiscal Q4 AI revenue to $21.7B and total revenue to $34.8B. The reported quarter adds direct evidence of custom-accelerator and networking demand; the next-quarter figures are management forecasts.

Distillate rebuilding leaves the seasonal gap intactU.S. Energy Information Administration

For the week ended August 28, EIA’s September 2 estimates show a 4.5M-barrel commercial crude draw and a 0.8M-barrel distillate build. Distillate stocks remain 14% below the seasonal five-year average, while four-week products supplied fell 4% year over year versus 3% in the prior release. The build has not closed the product-stock shortfall, and the supplied-volume measure weakens the demand-boom explanation.

updates 2026-08-27 · prior evidence ↗

Bessent says he expects interest rates will fall once "we get on the other side" of the Iran conflict, and that today's AI investments could be "extremely disinflationary" with results showing up "in the next six months." "The economy here is very, very strong and I think we're accelerating. And this is in the face of this Iran conflict. Interest rates will come down when we get on the other side of this. The economy will accelerate. And I would add too that right now we have what Alan Greenspan would've called a conundrum, that we have large borrowings by AI institutions that are businesses that are meeting these incredible CapEx needs. At a point, as we heard from our private sector partners yesterday, this CapEx will turn into productivity and that will be extremely disinflationary. So I would guess that in the next six months, we will start seeing the benefits of that."

Treasury Secretary Scott Bessent forecast that AI capex will turn into productivity gains that become ‘extremely disinflationary,’ with benefits starting within six months. The deadline makes the claim testable against productivity, unit-cost and inflation data; it remains a policy forecast, not an observed disinflation result.

日経平均、終値1889円安 世界金利高でよぎる「うたげの終わり」 https://t.co/1Dau0th3l0

The Nikkei closed 1,889.70 points lower, down 2.85%, as rising global yields weighed on equities. That extends yesterday’s Japanese 10-year yield milestone into a cross-asset selloff; one session does not establish how long the pressure will last.

updates 2026-09-01 · prior evidence ↗

A new reserve decomposition separates active portfolio shifts from changes in countries’ reserve size. For 2019–23, the 62 countries with complete data contributed little to the aggregate dollar-share decline; the researchers infer a concentrated effect from four large holders with missing data. That changes how the aggregate trend should be read, but the missing allocations prevent a directly observed country-by-country attribution.

Sentiment

AI expansion, subdued hiring -0.08

475 source items · 70% editorial confidence